Correlation means two things move together. Causation means one of them produces the other. Correlation is descriptive and symmetric; causation is directional. When researchers look at difference between correlation and causation examples, the pattern is always the same: a real relationship that a hidden third variable, a backwards arrow or plain coincidence explains just as well.
That is the whole idea, and it is worth holding onto before the examples. If two things change together, you have learned something real about them. You have not learned that either one does anything to the other. A correlation tells you where to look. Causation tells you whether changing something would change the outcome, which is a much harder thing to establish.
The examples below run from the jokes you have probably already heard to the harder cases that show up in health and ethnomedicine research, where a genuine cultural association and a proven effect are constantly confused for each other.
Table of Contents
- 1Difference Between Correlation and Causation Examples at a Glance
- 2What Is Correlation?
- 3What Is Causation?
- 4How Can You Tell the Difference Between Correlation and Causation?
- 5What Research Methods Help Establish Causation?
- 65 Difference Between Correlation and Causation Examples
- 7Example 1: Ice Cream Sales and Sunburn
- 8Example 2: A Plant Extract and Lower Blood Pressure
- 9Example 3: Treatment Use and Better Health Outcomes
- 10Example 4: Exercise and Lower Reported Stress
- 11Example 5: Community Ceremonies and Lower Reported Stress
- 12Why People Mistake Correlation for Causation
- 13How to Evaluate a Claim That Something Causes Something Else
- 14Which Should You Choose?
- 15Frequently Asked Questions
- 16Does correlation ever prove causation?
- 17Can a randomized experiment still fail to prove causation?
- 18What is the difference between confounding and an intermediary variable?
- 19Does temporality alone establish causation?
- 20Why do medical studies describe correlation without claiming cause?
- 21How can I check whether a health headline has overstated its research?
- 22Conclusion
Difference Between Correlation and Causation Examples at a Glance
| Criterion | Correlation | Causation |
|---|---|---|
| Direction | No direction; X and Y simply co-vary | Directional: X produces Y |
| Symmetry | Symmetric, so r of X on Y equals r of Y on X | Not symmetric; reversing the arrow usually breaks it |
| Question it answers | Are these two things related? | Would changing this change that? |
| How it is established | Observed co-variation, measured as a coefficient | Evidence that rules out rival explanations |
| Evidence type | Mostly observational, sometimes experimental | Experimental or quasi-experimental |
| Study design needed | None beyond measuring both variables | Randomised experiment, or a design that approximates one |
| Can you infer direction from it? | No, not on its own | Yes, that is the claim being made |
| Typical mistake | Treating a strong number as a mechanism | Assuming a plausible mechanism counts as proof |
Read the last row carefully. A strong correlation coefficient is a measurement, not an explanation. Causation needs the explanation, and the evidence for it, to come separately.
What Is Correlation?
Correlation is a measured relationship between two variables: a descriptive summary of how they tend to change together in the data you collected. A positive correlation means they move in the same direction, so one goes up as the other does. A negative correlation means they move in opposite directions.
The number behind it is usually Pearson’s r, which runs from minus one to plus one and captures linear relationships. When the data is ranked rather than measured cleanly, or the relationship is not a straight line, researchers use Spearman’s rho instead. Both tell you the strength and direction of co-variation. Neither tells you why.
One property matters more than the arithmetic, and it is the one people forget: correlation is symmetric. If ice cream sales rise with sunburn rates, the correlation of sales on sunburn is exactly the same number as sunburn on sales. The statistic has no opinion about which came first, which is precisely why it cannot answer a causal question.
Association is the looser cousin of correlation. It just means two things are linked in some way, and it carries no assumption of a consistent pattern at all. In ethnobotanical fieldwork, association is usually where a claim starts: a recorded link between a plant and a practice, waiting to be tested properly.
What Is Causation?
Causation means one variable produces a change in another. That is a stronger and more specific claim than co-variation, and it comes with obligations: the cause has to come before the effect, the effect has to be real, and the reasonable alternatives have to be ruled out rather than ignored.
Researchers usually sort causation into three shapes, which answers the people-also-ask question about the three types of causation:
- Direct causation, where the cause acts on the effect with nothing in between. Smoke damages lung tissue; nothing stands between the two.
- Mediated causation, where the cause works through an intermediary variable. A dietary pattern affects a nutrient level, which then affects a measured outcome. The arrow points through the middle.
- Probabilistic causation, where the cause raises the odds without deciding any individual case. Smoking does not guarantee lung cancer in any one person; it sharply raises the likelihood across a population.
The probabilistic case is where most real-world confusion sits. If something causes an outcome only some of the time, an observational study of who did what and who got sick can look full of exceptions. Those exceptions are not counter-evidence. They are what a probabilistic effect looks like from the inside.
How Can You Tell the Difference Between Correlation and Causation?
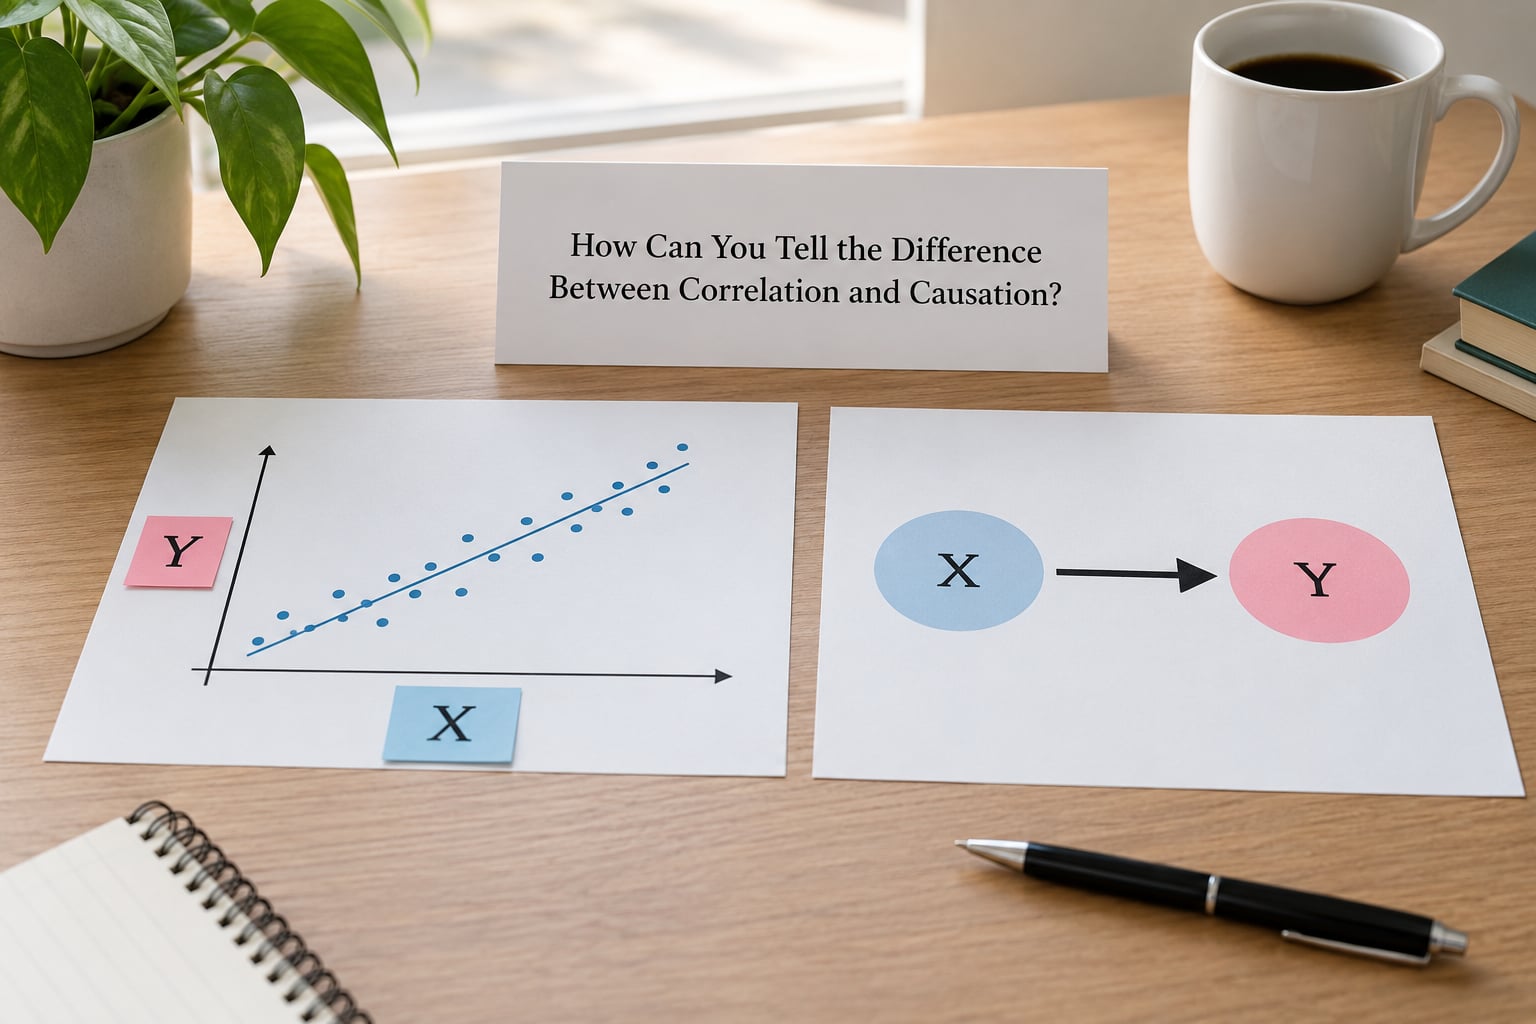
Run through these questions whenever someone tells you that one thing causes another. You do not need statistics to use them, only the willingness to look for what the claim leaves out.
- Does the cause come first? Temporality is the one requirement with no exceptions. An effect cannot precede its cause, so a finding where the outcome is measured before the supposed cause has described the relationship backwards.
- What else tracks both variables? Hunt for the third variable. Age, income, season, baseline health and access to care explain an enormous share of observational findings that look causal at first glance.
- Could the arrow point the other way? Poor health can lead people to stop exercising rather than exercise leading to poor health. Check whether the same mechanism would run in reverse.
- How many comparisons did they make? A research group that tested two hundred relationships will find roughly ten that look significant by chance alone. The more comparisons, the more demanding the standard.
- Who ended up in each group? People are not assigned at random in an observational study. If volunteers in one group differ systematically from volunteers in the other, the groups were never comparable.
- Does the size of the effect matter to anyone? A very large sample turns a trivial difference into a statistically significant one. Significance is not the same as practical significance, and headlines rarely check the difference.
The habit worth keeping from this list is step two. Name the hidden variable out loud, in plain words, before you decide what a finding means.
What Research Methods Help Establish Causation?
A randomised controlled trial is the strongest design because random assignment distributes confounders across groups by itself, before any data exists. If two groups that were assembled by coin flip end up with different outcomes, the difference in what they were given is the most plausible explanation left. Business teams call the same logic an A/B test, and it is the reason a landing-page headline can be settled in a fortnight.
You cannot always randomise. You cannot force people to smoke for thirty years, and you cannot randomise which policy a government adopted, which is why the polio vaccine rollout and falling US case counts became such a convincing natural experiment: cases fell from roughly 58,000 to about 5,600 by 1957 and to 161 by 1961, in step with the vaccination drive rather than before it.
Outside experiments, researchers rely on longitudinal cohorts that track the same people over time, natural experiments where an external event did the randomising, and methods that adjust statistically for measured confounders. Each has known weaknesses, and none of them is as strong as randomisation.
Austin Bradford Hill set out nine considerations for weighing causal evidence when experiments are impossible, including strength, consistency, temporality, a dose-response gradient, biological plausibility and coherence with existing knowledge. They are guidelines rather than a checklist with a pass mark, but they remain the standard vocabulary. David Freedman put the cost of getting this wrong bluntly: statistics done badly leads to misguided action. Judea Pearl later framed the whole problem as the distinction between seeing and doing, which is why a causal claim always needs an intervention attached to it.
5 Difference Between Correlation and Causation Examples
Each example below follows the same three-part pattern: what co-varies, why causation does not follow, and what is actually driving it. Look for the named third variable every time, because that is the transferable skill.
Example 1: Ice Cream Sales and Sunburn
The correlation: In hot weather, ice cream sales climb and so do sunburn counts, and the two track each other closely enough to look causal in a chart.
No causation: Nothing about frozen dairy raises anyone’s sun sensitivity.
The real cause: hot summer weather sends people to the beach and the shop in the same week. It is a classic confounding variable, and the same structure explains the shark-attack version of this example.
Example 2: A Plant Extract and Lower Blood Pressure

The correlation: People who regularly drink a preparation made from a regional plant show lower average blood-pressure readings than people who do not. The pattern holds across a study.
No causation: The people taking it differ from the people not taking it in ways the study may never have measured, including diet, activity, other medication, how long they have had the condition, and how likely they are to keep medical appointments at all.
The real cause: Any mix of those factors, and possibly the plant. The honest statement is that the preparation is associated with lower readings, and that only a controlled comparison can separate its effect from the people who chose it.
This is the exact shape of the evidence gap in traditional-medicine research, and it is the reason we keep returning to it. Widespread traditional use across generations is a genuine and valuable signal. It tells you where researchers should look first. It does not tell you the plant caused the improvement, and treating it as proof either way fails in both directions.
Example 3: Treatment Use and Better Health Outcomes
The correlation: People who receive a treatment recover more often, and hospital records show that recovery rate plainly.
No causation: Healthier or better-resourced people are both more likely to seek out treatment and more likely to recover, so treatment use partly measures the person rather than the treatment.
The real cause: baseline health and access sit behind both halves of the association. This is reverse causation and selection bias operating together, and it is why observational treatment comparisons need adjustment before they can carry a causal reading.
Example 4: Exercise and Lower Reported Stress
The correlation: People who exercise regularly report lower stress. This one is more interesting because the relationship is probably real in both directions.
No causation: The two also move together for non-exercise reasons. Sleep, income, social support and baseline health influence whether someone exercises and whether they feel stressed, so a survey alone cannot separate the exercise effect from the rest.
The real cause: exercise very likely does reduce stress for many people, but the observational study in front of you has not proven it. This is the honest middle position: causation is plausible and supported by trials, and the particular study you are reading still cannot carry the claim alone.
Example 5: Community Ceremonies and Lower Reported Stress
The correlation: Communities that hold shared traditional ceremonies more frequently report lower average stress among participants.
No causation: The ceremony is rarely the only difference between those communities and others. Participation may itself mark membership, belonging and support networks that would predict lower reported stress regardless of the ceremony.
The real cause: social belonging is a strong candidate, and it is one researchers genuinely want to isolate, since it has implications well beyond any one tradition. Belonging matters in ways that ceremonial participation may simply be measuring. Respect for that distinction is not disrespect for the practice; it is how a community’s own use gets studied honestly rather than either oversold or dismissed.
Why People Mistake Correlation for Causation
Several predictable errors drive the confusion, and recognising them is more useful than memorising a slogan.
- Assuming order settles it. Many causal-looking findings are comparisons, not sequences, so nothing establishes which came first. Timelines of aggregate numbers are easy to misread as a trend line.
- Believing the average hides nothing. Simpson’s paradox is the formal version: a relationship that holds within every group can reverse when the groups are pooled. In the shoe-size example, older children read better and have larger feet, so pooling across ages produces a strong correlation that collapses to nearly nothing inside each age band.
- Skipping baseline differences. Two groups that started in different places and ended in different places have not been compared like with like, however large the sample.
- Counting a story as a mechanism. People accept a correlation when they believe they already know how it would work, and reject the identical correlation when the mechanism seems odd. That filter is where red hair and blue eyes slip through: both come from the same underlying genetics.
- Trusting the verbs in a headline. Words like linked to, driven by and direct correlation get used as causal claims without the evidence to support them. The autism and MMR episode is the most cited example, and the pattern recurs whenever a preliminary finding meets a headline.
- Confusing significance with effect size. A large sample can make a difference of almost no practical importance look decisive. Ask what the difference is in real units before asking whether it is significant.
None of this makes correlations useless. They are the cheapest tool in research for finding patterns worth investigating. The mistake is spending that finding as though it were a result.
How to Evaluate a Claim That Something Causes Something Else
Use this sequence on any headline, abstract or traditional-healing claim you come across.
- Find the design. Randomised, observational, or a compilation of other people’s data? The design settles what the claim can support before any numbers do.
- Check temporality. Was the supposed cause measured before the outcome? If not, the direction is an assumption.
- Name the third variables. Write down what else could plausibly move with the cause and the effect. If you cannot name any, you have not looked hard enough.
- Compare the effect against the baseline. Was this group already different at the start? A gain from a low start is not a gain caused by the intervention.
- Ask about replication and dose. Has this finding appeared in separate studies with different groups and different researchers? Is the effect stronger with a larger dose, which fits a causal story better than a flat one?
- Trace who funded and reviewed it. One study in one journal is a starting point, not a finding.
Applied to a traditional-medicine claim, the same six questions are useful and fair. Generations of consistent use pass step four and say nothing about steps one and two. A controlled comparison against a placebo, with the other variables held steady, is what would move the claim forward, and where that evidence is genuinely thin the honest position is uncertainty rather than verdict.
For health decisions in particular, this framework is for reading evidence, not for choosing treatment. Whether a condition needs attention, whether an herb interacts with a prescription, and whether a therapy is safe for you are questions for a doctor or a pharmacist.
Which Should You Choose?
Correlation is the right tool when you want to describe what a dataset looks like, predict something roughly, or generate hypotheses worth testing. For screening data, spotting which patients need closer attention, or noticing that two measures move together in a new dataset, co-variation is exactly the job you want done, and it is honest to stop there.
Ask for a causal design when the decision changes what you do. Does this policy work, is this intervention effective, is this preparation safe at this dose, does changing this product increase sign-ups? Those questions need evidence that isolates the factor you are considering, which is why experiments, natural experiments and adjusted longitudinal studies exist.
Where you cannot get that evidence, and the stakes are health or safety, the correct description is association. Say the word association and you will rarely be wrong.
Frequently Asked Questions
Does correlation ever prove causation?
No. A correlation coefficient is a description of how two variables moved together in the data you have. Turning that into causation requires separate evidence: that the cause preceded the effect, that no hidden third variable explains both, and that the effect holds under controlled conditions. Causation always produces correlation, but correlation on its own never establishes cause.
Can a randomized experiment still fail to prove causation?
Yes. Randomization handles confounding but not everything. A trial can be too small to detect a real effect, can measure the wrong outcome, can be short enough to miss delayed harms, or can fail when the people in it are not like the people you care about. A result also depends on participants actually taking the treatment, which researchers check rather than assume.
What is the difference between confounding and an intermediary variable?
A confounder is a third variable that causes both the exposure and the outcome, creating a fake link. Adjusting for it changes your answer. An intermediary sits on the path instead, such as diet mediating the effect of an income change on blood pressure. Adjusting for an intermediary can remove the very effect you are trying to measure, so the two must not be handled the same way.
Does temporality alone establish causation?
It does not. Time order is necessary but not sufficient. Two things can occur in order and still be linked by a third factor that started earlier than both, which is why ice cream sales can rise before sunburn rates without either causing the other. Temporality rules out one specific mistake; ruling out the others needs a design that addresses them.
Why do medical studies describe correlation without claiming cause?
Because most medical research is observational, and doctors cannot randomise people into harmful exposures. Describing an association is the strongest claim the evidence supports, and saying more would be overstating it. Wording like associated with, linked to or correlated with is a signal that confounding and reverse causation have not been excluded, not a weakness in the study.
How can I check whether a health headline has overstated its research?
Find the original paper rather than the news story, then check three things. Did the study randomise anything, or did it only observe? How large were the groups? Were the people studied similar to people you are? If the headline names a cause but the paper describes an association, the headline has gone further than the research did, and that gap is worth reporting.
Conclusion
Correlation tells you two things move together. Causation tells you one produces the other, and only one of those two claims changes what you should do next. Between them sit confounders, reversed arrows and coincidences, and each of them is enough to manufacture a convincing story out of nothing.
So check the study design first, then look for what else could explain the pattern, and only then decide whether a cause claim holds up.