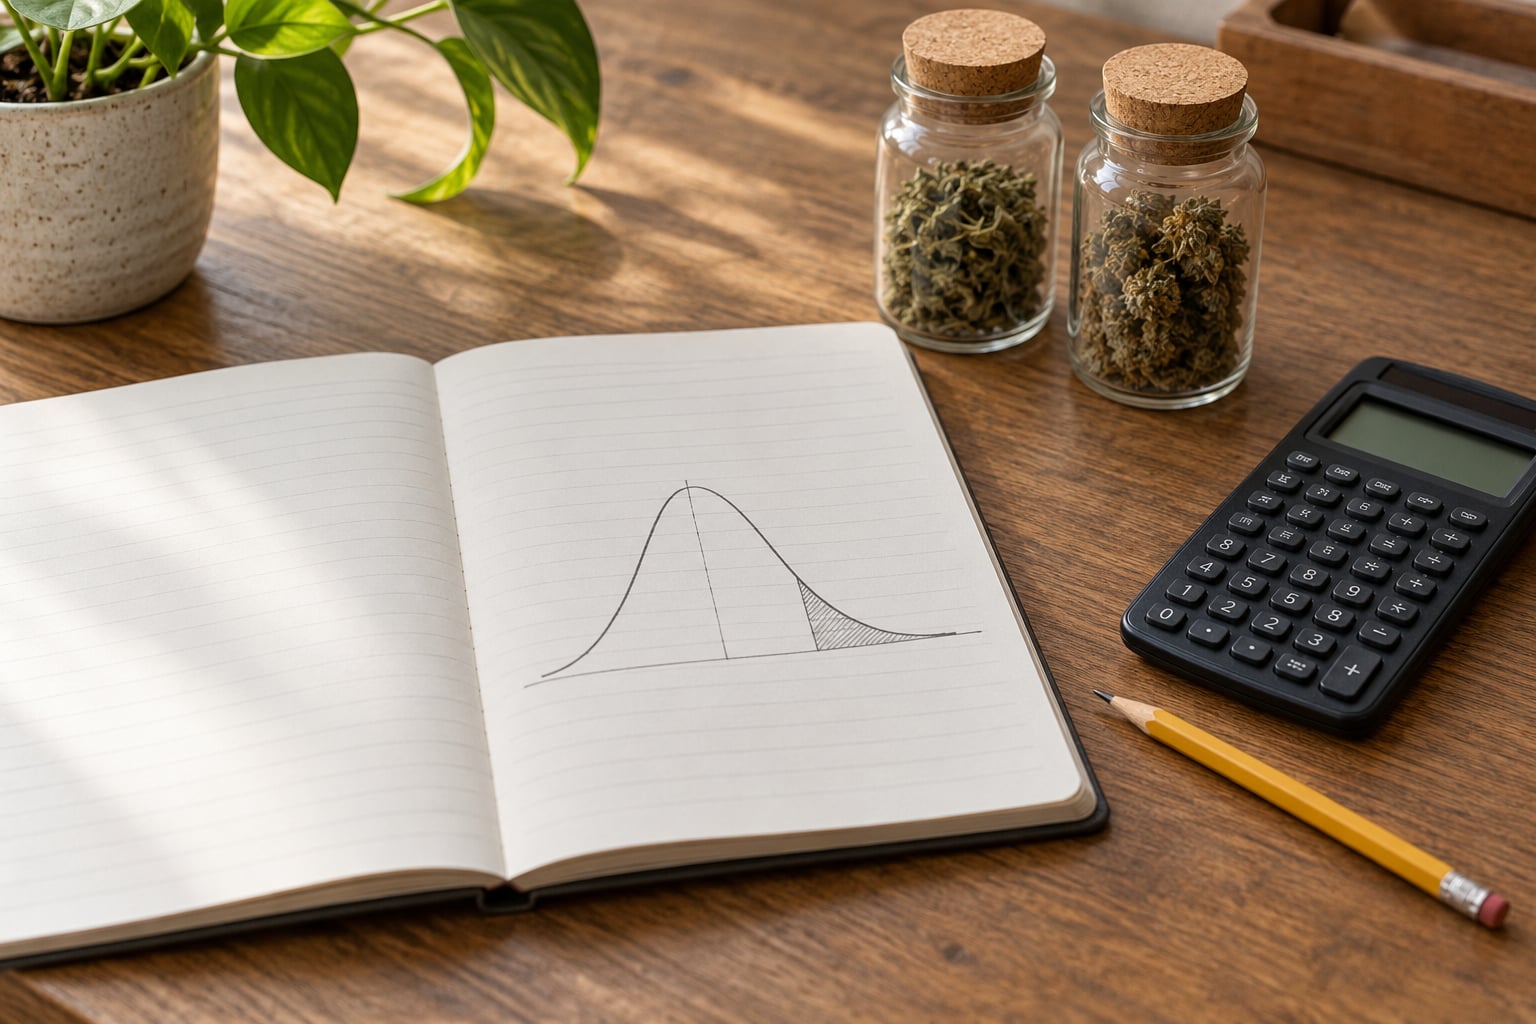
Statistical significance means a study’s result is unlikely to have turned up by random variation alone, given the assumptions of the test used to analyse it. In practice it is a threshold call: the calculated p-value lands below the level the researchers set in advance, usually 0.05. That is genuinely useful, and it is also routinely read as more than it is. This guide explains what the phrase does mean, what it does not, and how to judge a claim that quotes nothing but a p-value.
Updated October 2026.
Table of Contents
- 1What statistical significance really means in plain English
- 2The one-sentence version to quote
- 3What is a p-value?
- 4What does it mean when a result is statistically significant?
- 5How are the significance level and p-value different?
- 6Why can a tiny p-value be misleading?
- 7Is statistical significance the same as scientific importance?
- 8How do confidence intervals help readers interpret a result?
- 9What should a research report include when claiming significance?
- 10Frequently Asked Questions
- 11Is p u0026lt; 0.05 always statistically significant?
- 12What does a p-value of 0.05 actually mean?
- 13What is the difference between statistical significance and clinical significance?
- 14Why can a statistically significant result still be unimportant?
- 15What is a Type I error?
- 16How should I read a confidence interval?
- 17What to check first next time you see a p-value
What statistical significance really means in plain English
Every significance test starts with a null hypothesis, usually the plainest possible statement: the treatment does nothing. The plant extract is no better than a sugar pill. The new teaching method does no better than the old one. The study then asks, if the null hypothesis were true, how likely would data like ours be?
That is the whole idea behind what statistical significance really means. A result is called significant when the data are unusual enough, under the assumption that nothing is going on, to justify setting the null aside.
Two things follow immediately. First, significance is a statement about the data and the model, not about the world. Second, a significant result is a reason to keep looking, not a proof. A randomized controlled trial of a bark extract against placebo might produce a p-value of 0.02 and a difference in symptom scores of half a point on a twenty-point scale. Statistically real, practically nothing.
The one-sentence version to quote
Statistical significance means: given the null hypothesis is true and the test’s assumptions hold, results this extreme would be unlikely, so the null is rejected at the chosen alpha level.
What is a p-value?
A p-value is the probability of seeing data at least as extreme as the ones observed, assuming the null hypothesis is true. Read that condition twice, because dropping it is where most public confusion starts. The p-value never tells you the probability that your hypothesis is true, and it never tells you the probability that the result was a fluke.
Here is what different values actually imply, and what readers usually take them to mean.
| p-value | Strength of evidence against the null | Common reader takeaway | Correct takeaway |
|---|---|---|---|
| 0.001 | Strong, within a well-run test | The finding is certain | Data this extreme would be rare if the null were true, given all model assumptions |
| 0.01 | Strong | Almost certainly real | Unusual under the null, but still not a measure of size or importance |
| 0.03 | Reasonable | Borderline, so probably not real | Cleared the pre-set threshold; read the effect size and interval |
| 0.05 | Right at the conventional line | Either a breakthrough or noise | One arbitrary cut-off out of many defensible ones |
| 0.09 | Weak, but not nothing | Proved there is no effect | Failed to reject the null; the study may simply have been too small to detect a real effect |
A p-value of 0.03 is not a 3 percent chance that you are wrong. It is a statement about how the observed numbers would behave in a world where the null was true. If you need one sentence to remember, use this one from the p-value fallacy literature: the p-value is not the probability that the null hypothesis is true, nor the probability that the result is a chance fluke.
What does it mean when a result is statistically significant?
In ordinary language: if the null hypothesis were true, we would not expect to see a difference this large. That is genuinely the end of the claim, and everything beyond it needs other evidence.
The word conditional matters more than most readers realise. Significance rests on the test statistic matching the shape of the data (a t-test on badly skewed scores, for instance, misbehaves), on the sample being representative of the people studied, and on nobody having quietly dropped out and quietly removed the inconvenient participants. Break any of those and the p-value still prints a number, but the number no longer supports the sentence attached to it.
And significance is never a statement about causation on its own. That a pre/post survey found lower blood pressure readings after three months of a preparation tells you something about the before-and-after comparison. It tells you nothing about what else changed over those three months. Randomization is what separates the preparation from the rest of life, and randomization is something a pre/post design cannot offer.
How are the significance level and p-value different?
The significance level, alpha, is the rule the researcher sets before looking at the data. The p-value is what the data produce. Setting alpha is deciding how much risk of a false alarm you will tolerate; computing a p-value is measuring how far the data fall from what the null predicts.
| Significance level (alpha) | p-value | |
|---|---|---|
| When it is set | Before the data are seen | After the data are collected |
| Who chooses it | The researcher, as a convention | The arithmetic |
| What it is | A cut-off rule, commonly 0.05 | A calculated value, such as 0.03 |
| What it cannot tell you | Whether the finding matters | Whether the hypothesis is true, or how big the effect is |
Choosing alpha after seeing the p-value is one of the most common ways a study manufactures a result, which is why journals ask for it to be declared in advance. R. A. Fisher proposed 0.05 in 1926 as a convenient convention for exploratory work, not as a law of nature. Some fields use 0.01, some use 0.10 for exploratory screens, and plenty of good studies report the exact value so readers can apply their own threshold.
Why can a tiny p-value be misleading?
A very small p-value can come from a real effect, or from several routine research habits. Readers cannot tell which from the number alone.
- Multiple comparisons. Test twenty outcomes and one will usually cross 0.05 by luck. No correction for that, and the headline lands.
- Optional stopping. Peeking at results every week and stopping the moment p drops below 0.05 produces small p-values far more reliably than chance alone would allow.
- Selective reporting. Measuring dozens of outcomes and publishing the significant ones is the most common form of p-hacking, and it is nearly invisible unless the study protocol is registered in advance.
- Very small samples. With ten participants per arm, an unstable estimate can produce an extreme p-value from an effect that will not survive a second look.
- Data errors and missing data. A duplicated entry or an outlier that got dropped changes the arithmetic, and sometimes flips the verdict.
- Assumptions nobody checked. p-values assume roughly independent observations and roughly appropriate distributions. Plant surveys that pool data from several villages or count the same remedy twice break both.
- Publication bias. Studies with significant results are more likely to be written up and published, so the literature looks stronger than the underlying evidence.
This is why the 2019 special issue of The American Statistician, written by more than seventy statisticians, argued that p-value thresholds should stop being treated as pass-fail gates. Their recommendation was not that significance is meaningless, but that it should never be reported alone. The number to look for instead is the exact p-value, the confidence interval, and a description of what was measured and how many things were measured.
Is statistical significance the same as scientific importance?
No, and the gap between the two is where most bad health headlines live. Statistical significance answers whether an effect is distinguishable from zero in this sample. Scientific importance asks whether the effect is large enough to matter to anyone.
The practical measure is effect size, commonly expressed as Cohen’s d, which describes the gap between groups in standard-deviation units. Conventional reading: about 0.2 is small, 0.5 medium, 0.8 large. Those benchmarks are conventions rather than natural boundaries, but they give a reader something comparable when a paper omits the number.
Here is the asymmetry that confuses people. A trial of 10,000 participants can detect a difference so small it changes nothing for the person taking the treatment, and will report it with a p-value of 0.001. A trial of 24 participants can miss a difference that genuinely matters, because the study lacks the statistical power to detect anything except something huge. A p-value of 0.30 is not proof of nothing happening; it is often proof that the study was too small to tell.
Statistical power, usually written as 1 minus beta, is the probability that a study will detect an effect of a given size when one truly exists. Many herbal and ethnobotanical trials are powered for large effects that traditional-use traditions never promised, which guarantees a null finding regardless of how useful the preparation is.
How do confidence intervals help readers interpret a result?
A confidence interval gives the range of plausible values for the effect, along with a stated level of confidence, commonly 95 percent. Instead of a pass-fail label it tells you both the size of the effect and how imprecise the estimate is.
Suppose a study reports that a plant preparation reduced a symptom score by 3.1 points, 95 percent confidence interval 0.4 to 5.8. The interval excludes zero, which is the same underlying statement as a p-value below 0.05. But it also shows the effect could plausibly be as small as 0.4 points, and that depends on how precise the scale is.
A tight interval tells you the estimate is reliable. A wide one tells you the study was too small to pin the number down, however impressive the midpoint looks. An interval that spans zero means the study could not distinguish a real effect from none, which is a statement about precision rather than about reality. An interval that spans both a meaningful benefit and a meaningful harm tells you the honest answer is still unknown, and that is worth knowing before you act on the headline.
What should a research report include when claiming significance?
When you meet a claim about a plant, a preparation or a traditional practice, run these eight checks. Most will take a couple of minutes once you have the paper or the abstract.
- Was the hypothesis stated before the study ran? A registered protocol or trial identifier is the strongest evidence that the analysis was not reverse-engineered from the results.
- How many people were in each group? A single-digit arm makes almost any p-value unstable.
- What was actually compared? Preparation against placebo, or preparation against nothing, or before-and-after within the same people? Only the first two isolate the preparation itself.
- What was the effect size? If only p appears, treat the claim as incomplete.
- What does the confidence interval cover? Narrow is reassuring; spanning zero, or spanning both benefit and harm, is a warning.
- How many outcomes were measured? Twenty measurements and one significant result is a coin flip, not a discovery.
- What was dropped along the way? Look for attrition: participants who left the study are usually missing from the final count for a reason.
- Has it been replicated? One study is a hypothesis. Repeated, independent work in separate settings is what builds confidence, particularly in a field where preparation methods vary widely.
Two details raise trust immediately when they are present: a systematic review pooling several studies rather than a single trial, and reporting guided by a named standard such as CONSORT for trials or STROBE for observational work.
Frequently Asked Questions
Is p u0026lt; 0.05 always statistically significant?
It is significant by the usual convention, but the convention is weaker than it sounds. The threshold was picked in advance as a convenience, not derived from nature, and 0.049 is treated as significant while 0.051 is not, even though nothing about the underlying evidence changed between them. Researchers who set a stricter 0.01 threshold would call 0.04 a failure. Always read the exact value alongside the effect size and confidence interval rather than treating the line as a switch.
What does a p-value of 0.05 actually mean?
It means that, assuming the null hypothesis is true and every assumption of the test holds, data this extreme or more extreme would occur about 5 times out of 100. It does not mean there is a 5 percent chance the null is true, and it does not mean there is a 95 percent chance the finding is correct. That last misunderstanding is common because 1 minus 0.05 looks like a confidence figure, but p-values and probabilities about hypotheses are different animals.
What is the difference between statistical significance and clinical significance?
Statistical significance says the result is distinguishable from zero in this sample. Clinical significance asks whether the effect is large enough to matter to a real person: enough symptom relief, enough added safety, enough change in daily life. A study can clear the p-value threshold while shifting a symptom score by a fraction of a point that nobody would notice. Conversely a modest real benefit may miss the threshold in a small trial that was never powered to detect it.
Why can a statistically significant result still be unimportant?
Significance measures how unusual the data look under the null, and very large samples make even tiny differences look unusual. A trial with thousands of participants can report p of 0.001 for an effect too small to notice. When the same test is run on twenty outcomes at once, one will cross the line by chance alone. The p-value also says nothing about causation unless participants were randomly assigned, and nothing about whether the measurement was reliable.
What is a Type I error?
A Type I error is a false positive: the study rejects the null when the null was true all along. In plain terms, a treatment that does nothing appears to work. The significance level alpha is the long-run rate of Type I errors, so alpha of 0.05 means about 5 in 100 similar studies would flag an effect where none exists. Running many analyses on the same data raises that rate sharply, which is the core mechanism behind p-hacking.
How should I read a confidence interval?
Start at the midpoint, which is the estimated effect size, then look at the width. A narrow interval spanning a meaningful range is a reasonably precise estimate. A wide one means the study could not pin the effect down. An interval crossing zero means the study failed to distinguish an effect from none, which is a statement about sample size rather than about the preparation. An interval reaching from benefit to harm means the honest answer is still open.
What to check first next time you see a p-value
Look for three numbers before anything else: how many people were in each group, what the effect size was, and how wide the confidence interval is. If a claim quotes only a p-value, the study has given you the least informative part of its own results.
Significance is a useful discipline. It stops a single lucky fluctuation being announced as a discovery, and it is worth keeping. What it cannot do is tell you how much the effect matters, whether it causes anything, or whether it will repeat. That last judgement is built from effect sizes, intervals, replication and honest reporting, which is exactly what statistical significance alone leaves out.